Family Tree Maker is a name known for genealogy software for more than three decades. The 2019 version of the program keeps up with the tradition by making it user-friendly while still offering all the powerful features to visualize the family history. Charts and reports are at the heart of the functionality, which provides ways of representing the family tree in clear and visually appealing ways.
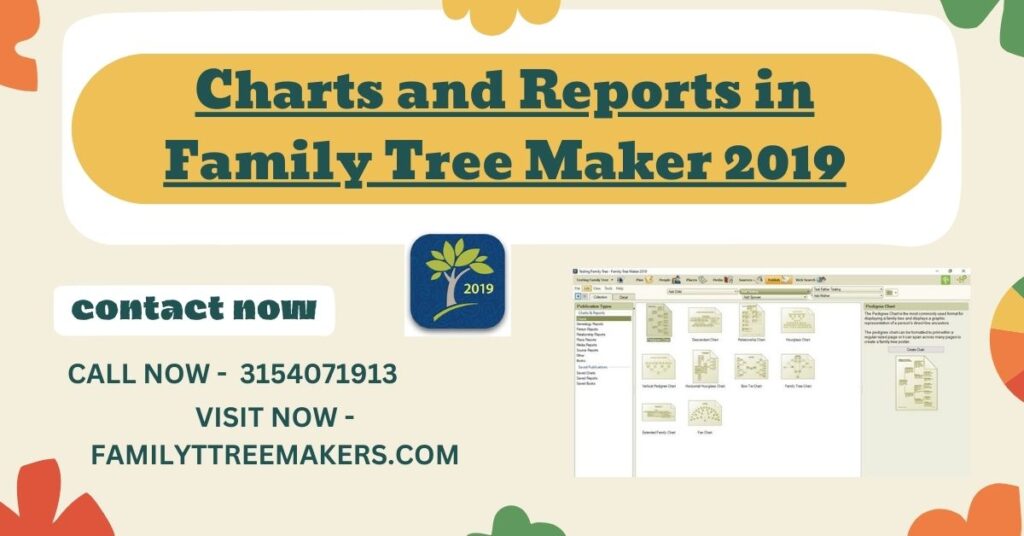
Charts and Reports in Family Tree Maker 2019
Family Tree Maker (FTM) 2019 is one of the most powerful genealogy and family history tools currently available. A multitude of options for organizing, managing, and visualizing your family history characterize the software. But what really shines are its charts and reports, making unprocessed data come alive into something meaningful, and visually rich. Whether you’re just starting out or have been researching your family tree for years, FTM 2019 provides a range of options to help present family history in an accessible and organized way.
Types of Charts in FTM 2019
FTM 2019 allows for several types of charts. Each is good for a slightly different genealogical purpose. Here the types of charts in FTM 2019 explained as:-
- Pedigree Chart- Pedigree is a chart concentrating on an individual’s direct line of ancestors and is useful when tracing lineage several generations back. It is straightforward and gives an excellent overview of family heritage.
- Descendant Chart:- Unlike the Pedigree Chart, the Descendant Chart focuses on an ancestor’s descendants, which gives a full view of family growth across generations. It’s perfect for visualizing how a family has expanded over time.
- Fan Chart:- The fan chart displays information about the family in a circular layout centered around a key individual. Its format makes way for a neat, visually compelling display of information about the family, which may be useful in storytelling or for presentations.
- Tree Charts:- Completely flexible, Tree Charts can include photos, notes, and extensive detail for each family member in the tree. It offers a number of chart options that can be used to present family history in multiple ways.
Reports Available in FTM 2019
In addition to charts, FTM 2019 provides numerous reports, containing a wealth of information. These reports provide an overview of the life of an individual, including his birth, death, relationships, and notes. Here are the reports explained as:-
- Family Group Sheets:- Family Group Sheets summarize the family unit as a whole consisting of parents and children with associated events and relationships.
- Relationship Reports:- These reports depict the links between individuals by showing how multiple family members may be related, thus visualizing complex family connections.
- Sources Reports:- Sources Reports track linked records and documents and ensure that your genealogical research is not only accurate but reliable.
Customization and Sharing Capabilities
FTM 2019 provides maximum customization for charts and reports. Users can alter layouts, colors, fonts, and data to suit their tastes.Upon finalizing the designs, they can be easily shared digitally or printed out, making them wonderful moments for loved ones.
Conclusion
Family Tree Maker 2019 makes it easy to visualize and share family history through its rich charts and reports. These tools turn complex genealogical data into clear, engaging visuals, helping preserve family stories for generations to come. From simple family trees to intricate family networks, FTM 2019 provides the powerful resources to bring your family heritage to life.
Common Asked Questions
Yes, you can customize layouts, colors, fonts, and data in FTM 2019.
FTM 2019 provides Pedigree, Descendant, Fan, and Tree Charts.
Yes, FTM 2019 provides Individual Reports, Family Group Sheets, Relationship Reports, and Sources Reports.
Yes, Charts and reports can be saved digitally or printed for personal use and family presentations.
Yes, FTM 2019 offers extensive tools for working with multi-generational research, making the visualization and managing of large families easier.
Related Posts:


